Context Diagrams
What is it?
A Context Diagram (sometimes also referred to as a Level-0 Data Flow Diagram) is a common tool that Business Analysts use to understand the context of an entity being examined. Most descriptions of a Context Diagram limit this entity to a system that is being created or modified as part of a project, but the Context Diagram can also be applied to other entities.
There are at least three different specifications for creating Context Diagrams (that I can find at this time). They are: Gane-Sarson, Yourdon-DeMarco, and TOGAF. The main characteristics of each are described below.
Gane-Sarson and Yourdon-DeMarco
Context Diagrams in the Gane-Sarson and Yourdon-DeMarco styles generally consist of just four (4) standard elements. These are:
The Process
The Process (or system, or business entity, etc) being investigated. There should only be one process per Context diagram and it is generally displayed in the center of the diagram. The Process contains the name of the process or entity being investigated.
- In the Gane-Sarson style, the process is represented as a rounded-corner rectangle.
- In the Yourdon-DeMarco style the process is represented as a circle.
Data Stores
Data Stores are databases that are either created by the Process under review and used by outside parties, or created by outside parties and used by the Process.
- In the Gane-Sarson style, a Data Store is represented by a long, flat rectangle.
- In the Yourdon-DeMarco style, a Data Store is represented by two parallel lines (essentially an open-sided long, flat rectangle)
Note that data stores/databases may not show up on many context diagrams. If the database is part of an external system, you would show the overall system, not the database. Normally you only want to show a database when it is shared by your core process and another system. However, I like to use the database symbol for some external actors where most of what they provide is data (a 3rd-party data feed for example, or an external data processing system). I do this because I find stakeholders better understand the nature of that entity.
Actors
Actors (or Entities, or Terminators) are the parties that communicate either directly with the Process, or indirectly with the Process through an intermediary Data Store. According to Yourdon, in a Context Diagram the Actors should not be shown as communicating directly with each other.
- In the Gane-Sarson style, a Actor is displayed as a square shape.
- In the Yourdon-DeMarco style, a Actor is displayed as a rectangle.
Flows
Flows (or Relationships) represent data or events flowing between the three other components above. Flows are labelled and can be displayed as unidirectional or bi-directional.
- In both the Gane-Sarson and Yourdon-DeMarco styles, a Flow is displayed as a solid-line with an directional arrow indicator at either or both ends.
TOGAF Style
In the TOGAF Enterprise Architecture system the Context Diagram can be used to model a specific project. This Project Context Diagram uses up to fifteen (15) different model elements, and includes different elements for: [2]
- External Actors
- Internal Actors
- Business Requirements
- Interaction Application Components
- Functions
- Database Application Components
- Applications
- System Federations
- Use Cases
- Business Services
- Business Processes
- Information Flows
- Consumes Links
- Realizes Links
- Satisfy Links
Because I am unsure of the copyrights on the symbols used and my copy of Visio does not support TOGAF modeling, I will just refer interested users to this link at the TOGAF-Modeling.org web site: Project Context Diagrams.
A Note About Styles
Remember, the main purpose of a Context Diagram in the business analysis space is to communicate with stakeholders, not to specify data flows to developers. Feel free to skip the formal styles above and use any other diagram elements that are available to you and that make sense. If you use Visio, your stakeholders might react better to person shapes for external parties, computer shape for systems, disk shapes for databases, and similar changes that make the diagram more intuitive for them to understand.
Why do it?
In general, a Context Diagram can be used to examine:
- An existing system (to help determine what users and entities it interacts with)
- Stakeholder Identification
- A conceptual solution system (to help determine what users and entities it will interact with)
- A business unit (to help in understanding what entities a business unit interacts with)
- A problem space (to help identify the entities impacted by the problem or who help cause the problem)
- A project (to help identify the organizations, functions, services, processes, applications, data, and technology that will be added, removed, or impacted by the project)
Some more specific uses include:
System Context
As indicated above, most Context Diagrams are focused on identifying the context of a system.
- This can be a very good early step to help identify scope and potential stakeholders for a project involving that system.
- A limitation for Stakeholder identification is that Context Diagram will generally only identify the stakeholders who directly interact with the system, and may lead you to miss stakeholders further away down the process change who might be significantly impacted by changes.
- The Context Diagram can help with scope in identifying the specific events or data flows that are in scope. By creating a Context Diagram identifying all entities and data flows that are in scope, you can limit future scope creep or protect yourself from "how did you miss the XXX report requirements?!" if that report is not captured in the Context Diagram.
- The system context diagram can be improved over time with more detail as additional information is learned. For example, if part of the interaction of the system with an external entity takes place via an API, or email, this can be captured in the diagram. This identification of specific interfaces and methods then supports interface analysis efforts and similar system detailed analysis.
Stakeholder Identification
Creating a context diagram of a process or system is not just a great way to help determine the scope of an effort, it also helps identify the stakeholders who should be involved. This is also one of those times where strict adherence to the formal design standards for context diagrams should be skipped and you should show communication between actors or external entities as a way of identifying non-directly impacted stakeholders. You should add more detail to you diagram as the effort moves on and you learn more.
By skipping the level of detail in something like a Process diagram, the BA remains at a sufficient level of abstraction that the context diagram enables stakeholders to see the big picture while not getting bogged down or distracted by the details.
Business Knowledge
A great use for Context Diagram's comes up when BA's are first starting to work with a particular business unit or client. By starting with a Context Diagram that shows the standard interactions and relationships for that business unit, the BA can learn a great deal about the business and identify specific processes or use cases that merit further exploration.
Problem Analysis
The Context Diagram structure can also be used to analyze a problem.
- The Problem becomes the
Process
at the center of the diagram. - The Factors that influence the problem become the
Actors
or Entities. - The Interactions or characteristics of the Factors that drive, or result from, the interaction of the Factors and Problem become the
Flows
in the diagram.
For example, maybe the problem you are investigating is User dissatisfaction with our website
.
User dissatisfaction with our website
becomes the Problem label in the center of the diagram.- One Factor may be Speed, with interactions of
User bandwidth
andBrowser
version flowing into the problem (external factors contributing to the problem) and withserver capacity
,lack of a content delivery network
, andserver bandwidth
being interactions flowing out from the problem )internal factors that drive the problem out to the user.
When doing problem analysis, it rarely helps to limit the diagram to just those factors directly interacting with the problem domain, so the diagram may have connections several steps
away from the problem.
A more complex version of this problem analysis structure exists as the Problem Frame Approach.
How do I do it?
In the following steps I will demonstrate the creation of a Context Diagram for a simplified web-based order system using the Yourdon-DeMarco format, created with Enterprise Architect.
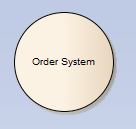
Step 1
The first step is the Process (or business entity, or in this case a system) that you are focusing on to the diagram. There should only be one Process per context diagram and this should be your first action. Note however, that the subsequent steps below can be done in whatever order you like.
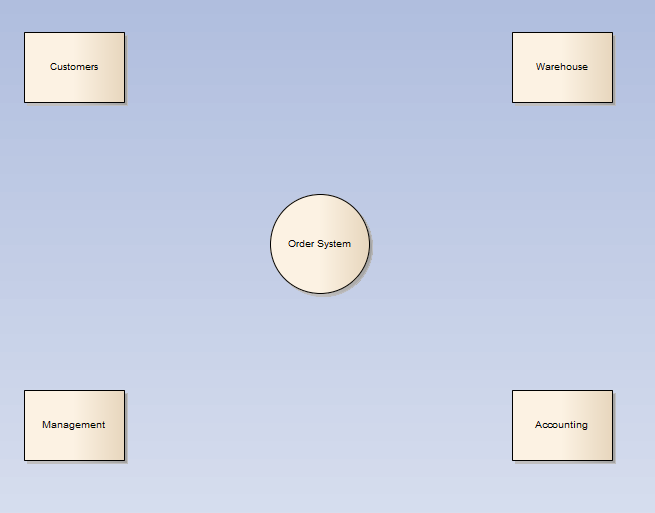
Step 2
For the second step, I am going to add the Actors. To start off, I can think of four actors who would interact with the Order system. They are:
- Customers
- Management
- Accounting
- Warehouse Operations
The updated diagram now looks like this:
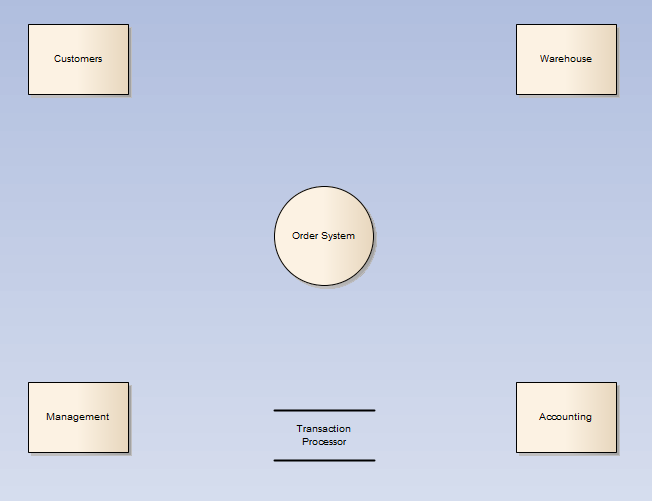
Step 3
For the third step, I am going to add a single external data store that represents the transaction processors system. Remember that with a context diagram you are modeling the factors external to your process, so any database that is internal to Order System is not modeled. I could have made this an external entity, but given that I am assuming the transaction processing is a fully automated process, I feel a data store makes more sense.
The updated diagram now looks like this:
Step 4
Now that the actors and data stores have been defines, the next step is show the interactions between them. If I was working with stakeholders to determine the interactions of an Order system, I might find the following common interactions and data flows between the entities diagrammed in Step 3.
- Customers:
- Place orders
- Cancel orders
- Receive order information
- Receive a shipping confirmation with a tracking number when their order ships
- Accounting:
- Receives an invoice when a customer places an order
- Sends a transaction request to the transaction processor for the payment method and amount of the customers order
- The Transaction Processor:
- Sends a status message to the order system indicating if the customers order has been successfully paid for
- The Warehouse:
- Provides inventory information to the order system, so that customers know if what they want to order is in stock
- Receives approved orders
- Provides a shipping status that is part of the customers order information
- Provides a tracking # when the customers order actually ships
- Management:
- Receives sales reports so that they can manage the business
With all of those interactions captures, the updated diagram now looks like this:
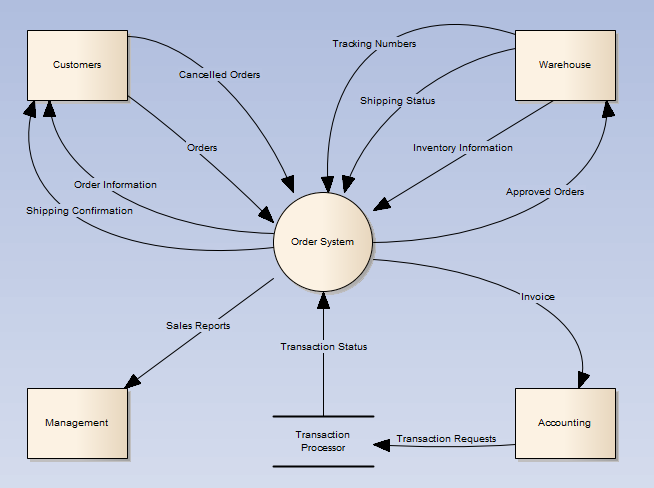
The final result might look like the diagram above. Or a slightly different version based (mostly, the Credit Bureau should be a flat rectangle) on the Gane-Sarson format that I created with Visio is shown below:

What Should the Results be?
From a Business Analysis perspective, the context diagram is mostly used to help determine the scope of the effort that is being undertaken. If for example you were beginning an initiative to improve the Order System itself or the order processing process in the business case above, you could work with your stakeholders to agree that only the items in the diagram are in scope.
For example, if the Warehouse later wanted to add a capability to auto-order certain products when inventory reached a certain point, you could point out that interactions with suppliers are not in the diagram above and thus not in scope.
The actors, systems, and flows captured in a context diagram also provide a starting point for Use Case Diagrams, process flow diagrams, class diagrams, and similar efforts to capture more detailed knowledge.
Flows can be used to:
- Identify probably system interfaces to begin interface analysis efforts
- Begin data dictionary creation work by identifying the specific data attributes that make up a flow
- Each flow is potentially one or more Use Cases
Risks
- As always with diagrams, there are risks in abstracting too much from reality (leaving important things out), or focusing so much on trying to include everything that the diagram loses part of its value by being too complex.
Tips
- Yourdon indicates that Actors should never communicate directly with each other in a Context Diagram, even if they do so in reality. But I have frequently ignored this limitation as I have found that showing communications between actors, even if some of those actors do not communicate directly with the system or entity under review, can be extremely valuable in identifying secondary stakeholders, confirming stakeholder knowledge of interactions, and providing more complete information.
References
- Wiki Article: The Context Diagram, by Ed Yourdon, in Chapter 18 of The Structured Analysis Wiki.
- Wiki Entry: Project Context Diagrams, on Togaf-Modeling.org
Resources
- Wikipedia article: System Context Diagrams
- Article: Introduction to Context Diagrams, by Morgan Masters, on Modern Analyst.
- Blog Post: What is a Context Diagram and What are the Benefits of Creating One?, from the Modern Analyst BA Interview Questions blog.
- Blog Post: The Context Diagram: Getting Started with Use Cases, by Matt Terski, on The Use Case Blog.
- Wiki Entry: Project Context Diagrams, on Togaf-Modeling.org
- Document: Process Modeling: Context Diagrams and Data Flow Diagrams (DFD's), by Eleanor Jordan, McCombs School of Business at the University of Texas at Austin.
- Article: Context Diagrams: An Explanation, by Precision Quality Software.
- Blog Series: Context Models, a series of 5 blogs by Meilir Page-Jones of Wayland Systems, Inc.
- Article: Putting Systems Analysis "Into Context" using the Context Diagram. By Tony Loton, on the Modern Analyst web site.