Stakeholder Maps
What is it?
Stakeholder maps are visual diagrams that depict the relationship of stakeholders to the solution and to one another. There are many forms of stakeholder map, depending on the issues being examined and the creators preferences. The most common form of a stakeholder map is a simple four-box chart similar to a SWOT Analysis diagram. However there are a number of other options used as well.
Why do it?
Stakeholder maps help identify particular stakeholders or stakeholder groups who have specific characteristics; or who need or may benefit from specific contact or management strategies. They also help guide stakeholder analysis and management discussions among the project team. However, the key benefit of Stakeholder Maps is not the maps themselves, but the analysis and discussion among the project team that goes into making them.
How do I do it?
The following are some examples of different types of Stakeholder Maps.
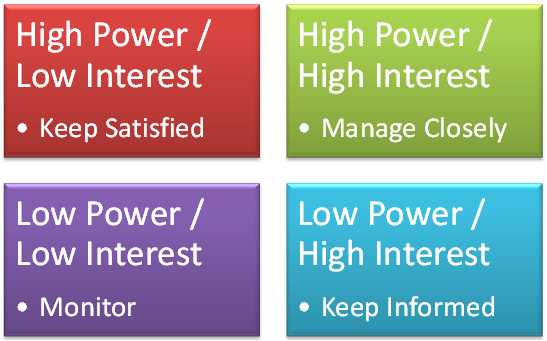
Power - Interest Map
A Power-Interest Map is usually drawn as a simple 2x2 grid that represents power on the vertical axis (low rising to high) and interest along the horizontal axis (low on the left to high on the right). The project team assigns stakeholders to different squares of the grid depending on their level of power and corresponding interest.
Power in this case refers to a stakeholders ability to exert power over the project and usually takes the form of decision-making power, budgetary power, or resource power. However, the project team can define the exact parameters in whatever way they feel best.
Interest in this case refers to a stakeholders interest in the project results, although a project team may want to create multiple power-interest maps for specific areas of the project or solution.
Assessing stakeholders along these two axis can help the project team in formulating a Stakeholder Management plan [1], and the Business Analyst in identifying critical stakeholders to elicit from, and validate and verify requirement with.
- High Power / High Interest Stakeholders: Sometimes referred to as "Promoters", these are the stakeholders that the project team must fully engage with and whom the BA must ensure are satisfied with the requirements. They are usually the primary forces behind the project initiation, funding, and goals. Because they have both the power and interest, their expectations must be managed carefully and effort made to keep them satisfied with the project progress and results. They are also the stakeholders who will likely be the most vocal if the project requirements do not meet their expectations. Because of their high power and interest, these are also the stakeholders who can cause the most disruption for a project if they are not kept informed and their expectations managed.
- High Power / Low Interest Stakeholders: Sometimes called "Latents", these stakeholders have the power to cause significant disruptions to the project (if not stop it outright), but they lack significant interest. This means that their expectations and needs must be understood and managed, but not to the degree of the high-interest stakeholders.
- Low Power / High Interest Stakeholders: Sometimes called "Defenders", these stakeholders have a high interest in the project deliverable(s), but little power. From a stakeholder management perspective these stakeholders usually need to be kept informed and provided the opportunity to have some input, even if their input is not always implemented. From a BA perspective, however, these are often the stakeholders who can provide a great deal of background information, user requirements, and non-functional requirements. However, if carefully managed they can be effective promoters of the project solution and built interest and help ensure adoption.
- Low Power / Low Interest Stakeholders: Sometimes called "Apathetics", these stakeholders don't have much power over the project, and have little interest in it. The stakeholder management strategy is usually just to monitor these stakeholders for issues. From a BA perspective, these stakeholders can sometimes have valuable information from a requirements perspective, but their lack of interest can make it difficult to identify the knowledge or appropriate stakeholder to engage with.
You can create a power - interest map very easily in Excel, or using the standard PowerPoint "Basic Block List" Smart Art as I have done below.
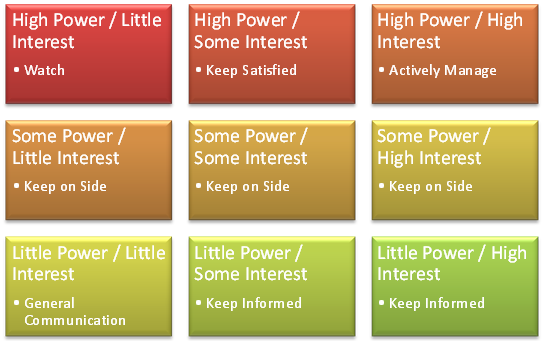
An alternate version of this power - interest map is sometimes done as a 3x3 grid, instead of 2x2. With this option instead of only binary high and low options along each axis, the grid uses three levels of Little, Some, and High for it's levels. The version of a 3x3 power-interest map looks like this: [2]
Power - Support Map
This is just like the Power-Interest Map above, except the project team assesses stakeholders along their level of power versus their level of support for the project. The goal is to map stakeholders into strong and weak supporters, and strong and weak opponents. Or if you want to include a Neutral
category, you can use the 3x3 grid format. [3]
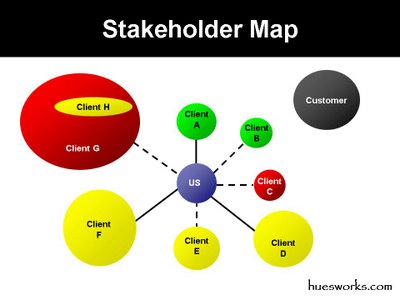
Hub and Spoke
This type of Stakeholder Map was proposed by Glenn Hughes [4] and takes the form of a Hub and Spoke layout. In the center of the map is the project or project goal. Around the central project are additional circles that are connected to the central project circle. The type of the line, the size of the stakeholder circle, and the color of the circle all have specific meanings. Hughes' original post used the definitions below and the example he provided is below that.
- Lines indicate relationships (solid = strong, dotted = weak, none = none).
- Size equals relative size of the client.
- Color equals the client feeling about the product or service (green = good, yellow = medium, red = bad, black = no feeling).
However, in order to make this a bit more generally usable, I would suggest making the following changes to the schema.
- The size of the circles is an indication of the power level of the indicated stakeholder in regards to the project. The larger the size, the greater the power in relation to the project (decisions, budget, or resources).
- The color of the circles is an indication of the stakeholder attitude to the project or solution.
- Green = Supportive
- Yellow = Cautious
- Red = Hostile
- Grey = Unknown or Indifferent
- The lines reflect the level of impact the project will have on the stakeholder.
- Solid lines = significant impact
- Dashed lines = moderate impact
- Dotted lines = minor impact
- No connection = No direct impact
This results in a diagram that could look something like this:

This diagram can be easily created using the drawing tools in PowerPoint, Visio, or Excel using the basic shape drawing functions.
What Should the Results be?
The results of creating a stakeholder map should be a better understanding of stakeholders in relation to the project and each other. The process of creating the map should result in knowledge of the stakeholders that will guide further stakeholder analysis and the stakeholder management effort.
Risks
- As with most graphs, there is always a risk of over-simplifying information in order to make it fit the graph design. This can detract from the value of the underlying analysis.
- As always with Stakeholder Analysis efforts, the project team may want to be cautious about sharing these maps outside of the project team. Labeling different stakeholder power and support levels can be a sensitive issue and could result in unwanted problems.
Tips
- It's often easier to start with the more simplistic stakeholder maps, and use the discussion and results of those efforts to create more complex maps with more complex underlying analysis.
References
- Article: Stakeholder Analysis - Winning Support for Your Projects. Rachel Thompson. On the Mindtools.com web site.
- Reference: Stakeholder Analysis Toolkit. Manchester Metropolitan University.
- Article: Some Practical Tools for Stakeholder Management. Esther Ham. From the Brainmates.com.au web site. 2011.
- Blog Post: How to Make a Stakeholder Map. Glenn Hughes. On the Huesworks blog. 2009.
Related Resources
- BABOK Guide v2, Section 2.2.5.3 - Stakeholder Map